NTA UGC NET Mass Communication and Journalism – Paper II
Unit 10 Complete Notes: Communication Research
1. Unit 10 at a Glance
| Syllabus Area | What to Prepare | PYQ Importance |
|---|---|---|
| Communication research | Meaning, nature, scope, scientific method, research problem, objectives and research questions. | Asked through direct concepts and method questions. |
| Types of research | Historical, descriptive, analytical, experimental, qualitative, quantitative, applied and evaluative research. | Important for method identification questions. |
| Variables and hypothesis | Independent, dependent, intervening/control variables, hypothesis, null hypothesis and causation. | Repeated PYQ area. |
| Sampling | Population, sample, sampling frame, probability and non-probability sampling techniques. | Direct terms and application questions. |
| Research methods | Survey, interview, focus group, observation, case study, content analysis and ethnography. | Highly repeated PYQ area. |
| Data and statistics | Mean, median, mode, standard deviation, standard error, confidence interval, correlation and scaling. | Important for statistics and scaling PYQs. |
| Media and audience research | Readership, listenership, viewership, ratings, public opinion surveys, pre-election surveys and exit polls. | Asked through media-specific research examples. |
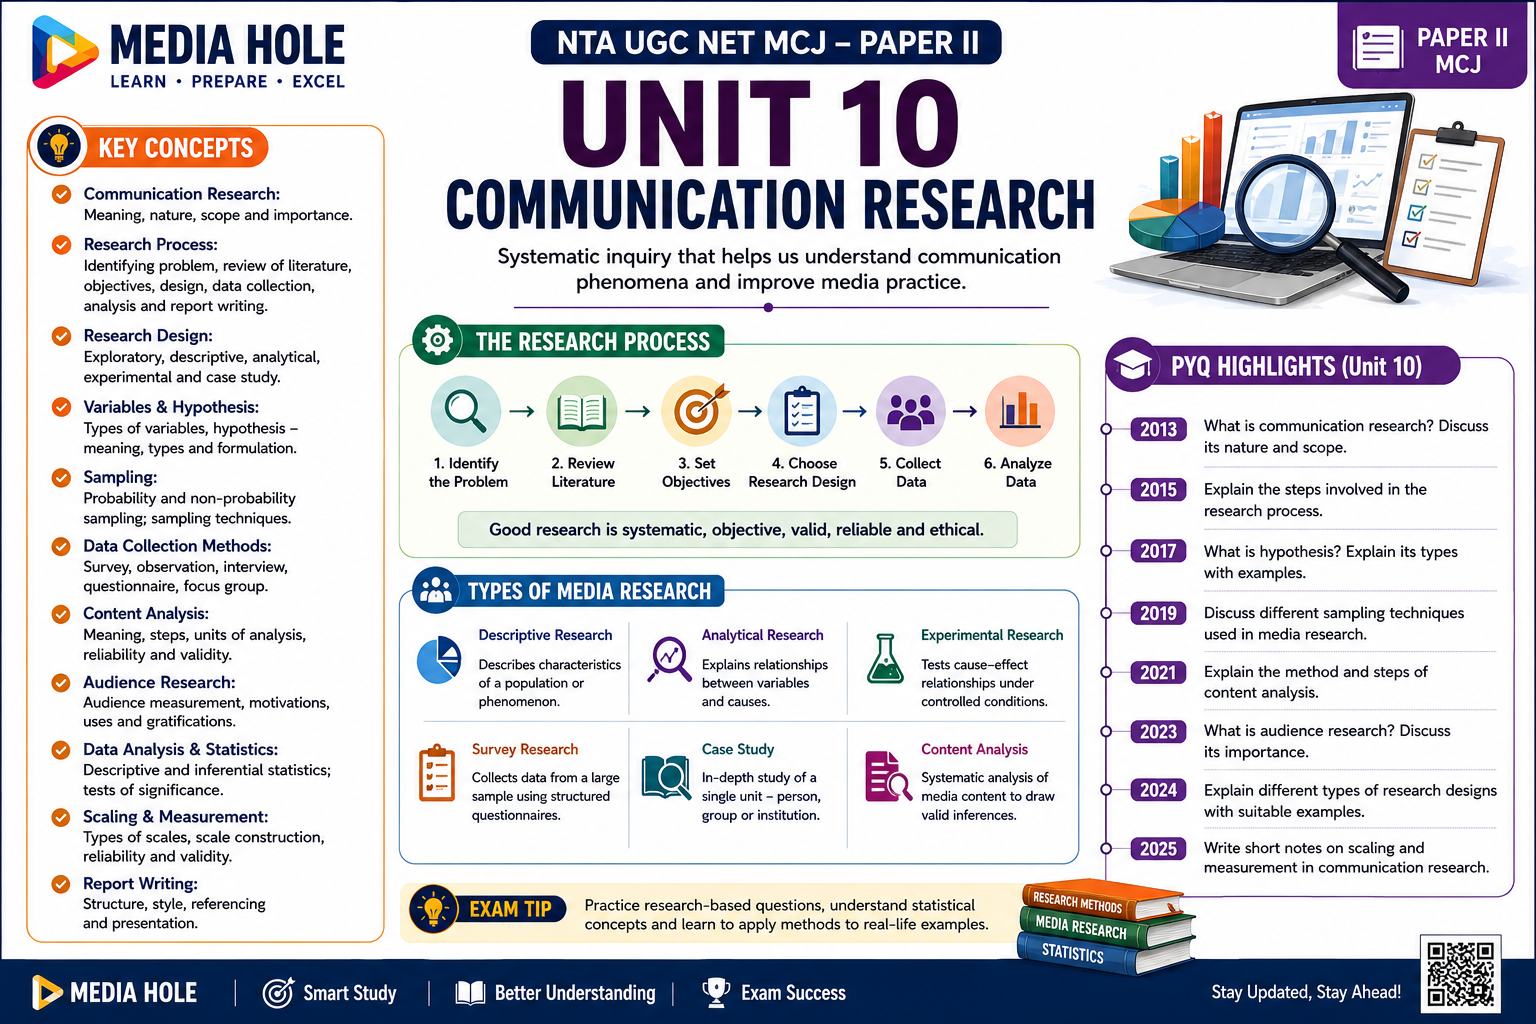
2. Infographic Flow: Research Process
3. Meaning of Communication Research
Communication research is the systematic and scientific study of communication processes, messages, media, audiences, effects, institutions and technologies. It helps understand how messages are produced, transmitted, received, interpreted and evaluated in society.
| Research Area | What It Studies |
|---|---|
| Message research | Content, themes, frames, symbols, language and meaning. |
| Audience research | Media habits, preferences, interpretation, uses and effects. |
| Media effects research | Impact of media on knowledge, attitude, behaviour and society. |
| Media institution research | Ownership, policy, newsroom routines, economics and management. |
| Technology research | Digital media, social platforms, ICT, algorithms and online behaviour. |
4. Scientific Method in Research
Scientific research follows systematic observation, logical reasoning, empirical evidence, verification and replicability. It attempts to reduce personal bias and arrive at reliable conclusions.
| Scientific Step | Meaning |
|---|---|
| Observation | Identifying a problem or phenomenon. |
| Question | Formulating what needs to be studied. |
| Hypothesis | Making a testable statement or prediction. |
| Data collection | Collecting evidence through appropriate methods. |
| Analysis | Interpreting data using qualitative or quantitative procedures. |
| Conclusion | Answering the research question based on evidence. |
5. Types of Communication Research
| Type | Meaning | Example |
|---|---|---|
| Historical research | Studies past events, documents and developments. | History of community radio in India. |
| Descriptive research | Describes existing conditions or patterns. | Media use habits among college students. |
| Analytical research | Explains relationships, causes or meanings. | Analysis of news framing in election coverage. |
| Experimental research | Tests cause-effect relationship under controlled conditions. | Effect of violent content on aggression scores. |
| Qualitative research | Explores meanings, experiences, perceptions and context. | Focus group on OTT viewing habits. |
| Quantitative research | Uses numerical data and statistical analysis. | Survey on newspaper readership. |
| Evaluation research | Assesses effectiveness of a programme, campaign or message. | Evaluation of a health communication campaign. |
6. Research Problem, Objectives and Research Questions
A research problem identifies what needs to be studied. Objectives state what the researcher wants to achieve. Research questions guide the inquiry and help decide the method and tools.
| Element | Example |
|---|---|
| Research problem | Low viewership of development-oriented television programmes. |
| Objective | To examine why development programmes fail to attract local viewers. |
| Research question | How does local specificity affect viewership of development programmes? |
| Hypothesis | Development programmes with local specificity receive higher viewership. |
7. Variables in Research
A variable is any quality or characteristic that can vary. Communication research may study variables such as media exposure, age, gender, attitude, knowledge, recall, satisfaction, political affiliation or viewing time.
| Variable Type | Meaning | Example |
|---|---|---|
| Independent variable | Variable that is expected to influence another variable. | Exposure to a campaign. |
| Dependent variable | Variable that is affected or measured as outcome. | Change in awareness or attitude. |
| Control variable | Variable controlled to reduce unwanted influence. | Age group, education level or prior exposure. |
| Intervening variable | Variable that comes between cause and effect and influences the relationship. | Motivation, interest or media literacy. |
| Discrete variable | Variable with separate categories. | Political affiliation, gender category, media ownership type. |
| Continuous variable | Variable measured on a continuous scale. | Age, time spent, income, rating score. |
8. Hypothesis
A hypothesis is a tentative and testable statement about the relationship between variables. It helps guide data collection and analysis.
| Hypothesis Type | Meaning |
|---|---|
| Research hypothesis | Predicts a relationship or difference. |
| Null hypothesis | States that there is no significant relationship or difference. |
| Directional hypothesis | Predicts the direction of relationship. |
| Non-directional hypothesis | Predicts a relationship but not the direction. |
| Operational hypothesis | Defines variables in measurable terms. |
9. Causation
Causation means that one variable produces change in another variable. In research, causation generally requires association, time order and elimination of alternative explanations.
| Condition | Meaning |
|---|---|
| Co-variation | Two variables change together. |
| Time order | Cause must occur before effect. |
| Non-spuriousness | Relationship should not be caused by a third variable. |
10. Sampling: Meaning and Key Terms
Sampling is the process of selecting a smaller group from a larger population for research. It saves time, cost and effort while allowing the researcher to make conclusions about the larger group.
| Sampling Term | Meaning |
|---|---|
| Population | The entire group about which the researcher wants to make conclusions. |
| Sample | Selected subset of the population. |
| Sampling frame | Source list from which a sample is drawn. |
| Sampling unit | Individual element selected for study. |
| Sample size | Number of cases included in the sample. |
| Sampling error | Error caused by studying a sample instead of the whole population. |
11. Types of Sampling
| Sampling Type | Meaning | Category |
|---|---|---|
| Simple random sampling | Every unit has equal chance of selection. | Probability |
| Systematic sampling | Every kth unit is selected from a list. | Probability |
| Stratified sampling | Population divided into strata and sample drawn from each stratum. | Probability |
| Cluster sampling | Groups or clusters are selected instead of individuals first. | Probability |
| Convenience sampling | Sample selected based on easy availability. | Non-probability |
| Purposive sampling | Sample selected based on researcher’s judgement and study purpose. | Non-probability |
| Quota sampling | Sample selected to fill specific categories or quotas. | Non-probability |
| Snowball sampling | Existing participants help identify more participants. | Non-probability |
12. Survey Method
Survey is a common research method used to collect data from a large number of respondents through questionnaires, schedules, online forms, telephone interviews or face-to-face interviews.
| Survey Type | Use |
|---|---|
| Cross-sectional survey | Collects data at one point in time. |
| Longitudinal survey | Collects data over a period of time. |
| Panel study | Studies the same sample at different points of time. |
| Trend study | Studies change in a population over time. |
| Opinion poll | Measures public opinion on an issue or candidate. |
| Exit poll | Survey conducted after voters leave polling stations. |
13. Questionnaire and Schedule
| Questionnaire | Schedule |
|---|---|
| Respondent usually fills it. | Researcher/interviewer fills it after asking questions. |
| Useful for literate and self-administered surveys. | Useful when interviewer guidance is needed. |
| Can be online, postal or printed. | Often used in field surveys and structured interviews. |
| May have lower control over response quality. | Allows clarification and better control over data collection. |
14. Interview, Focus Group and Observation
| Method | Meaning | Best Use |
|---|---|---|
| Structured interview | Uses fixed questions in fixed order. | Comparable data across respondents. |
| Semi-structured interview | Uses guide questions with flexibility. | In-depth media/audience experiences. |
| Unstructured interview | Open and conversational. | Exploratory qualitative research. |
| Focus group discussion | Group discussion guided by moderator. | Audience reaction, campaign testing, perceptions. |
| Observation | Researcher watches and records behaviour/events. | Newsroom study, media use in homes, online community behaviour. |
15. Content Analysis
Content analysis is a systematic method of studying media content. It can be quantitative or qualitative. It may examine themes, frames, words, images, sources, representation, tone, frequency or ideology.
| Content Analysis Step | Meaning |
|---|---|
| Define universe | Decide what content will be studied. |
| Select sample | Select newspapers, programmes, posts, articles or videos. |
| Create categories | Develop coding categories. |
| Coding | Classify content according to categories. |
| Reliability check | Ensure coders classify content consistently. |
| Analysis | Interpret patterns and meanings. |
16. Case Study and Ethnography
| Method | Meaning | Media Example |
|---|---|---|
| Case study | Detailed study of one case, organisation, event, campaign or community. | Case study of a community radio station. |
| Ethnography | In-depth study of people, culture and practices in natural settings. | Ethnography of news production in a newsroom. |
| Netnography | Ethnographic study of online communities. | Study of fan communities on social media. |
| Participant observation | Researcher participates while observing. | Researcher joins a newsroom or online group for study. |
17. Experimental Research
Experimental research tests cause-effect relationships by manipulating an independent variable and observing its effect on a dependent variable while controlling other variables.
| Experimental Term | Meaning |
|---|---|
| Experimental group | Group exposed to the treatment or stimulus. |
| Control group | Group not exposed to treatment, used for comparison. |
| Pre-test | Measurement before exposure. |
| Post-test | Measurement after exposure. |
| Random assignment | Participants are randomly assigned to groups. |
| Demand characteristics | Respondent reaction caused by awareness of experimental situation. |
| Double blind design | Both participant and researcher are unaware of treatment conditions, reducing bias. |
18. Measurement Scales
| Scale | Meaning | Example |
|---|---|---|
| Nominal scale | Classifies into categories without order. | Gender, newspaper name, political party. |
| Ordinal scale | Ranks categories in order. | High, medium, low; first, second, third. |
| Interval scale | Equal intervals but no true zero. | Temperature in Celsius. |
| Ratio scale | Equal intervals with true zero. | Age, income, time spent watching TV. |
| Likert scale | Measures agreement or attitude through ordered options. | Strongly agree to strongly disagree. |
| Semantic differential | Uses bipolar adjectives to measure attitude/image. | Good–Bad, Modern–Traditional, Trustworthy–Untrustworthy. |
| Thurstone scale | Equal appearing intervals. | Attitude measurement through weighted statements. |
19. Reliability and Validity
| Concept | Meaning |
|---|---|
| Reliability | Consistency of measurement. |
| Validity | Accuracy of measurement; whether the tool measures what it claims to measure. |
| Internal validity | Whether observed effect is truly caused by the independent variable. |
| External validity | Whether results can be generalised beyond the study. |
| Inter-coder reliability | Agreement among coders in content analysis. |
20. Basic Statistics for Communication Research
| Statistical Term | Meaning | PYQ Link |
|---|---|---|
| Mean | Arithmetic average. | Central tendency area. |
| Median | Middle value in ordered data. | Central tendency area. |
| Mode | Most frequently occurring value. | Central tendency area. |
| Central tendency | Single value representing a typical score in a distribution. | September 2013 Paper II. |
| Standard deviation | Measures spread of scores around the mean. | December 2014 Paper III. |
| Variance | Square of standard deviation. | December 2006 Paper II. |
| Standard error | Standard deviation of the sampling distribution of means. | June 2010 Paper II; September 2016 Paper III. |
| Confidence interval | Range with known degree of confidence containing true value. | September 2016 Paper III. |
| ANOVA | Analysis of variance; associated with R. A. Fisher. | December 2006 Paper II. |
21. Audience and Media Research
Audience research studies who uses media, how often, why, in what context and with what effect. It helps media organisations, advertisers, broadcasters and policymakers understand media consumption.
| Audience Research Type | Meaning |
|---|---|
| Readership research | Studies newspaper/magazine reading habits and audience profile. |
| Listenership research | Studies radio listening habits and preferences. |
| Viewership research | Studies television/video viewing habits. |
| Rating research | Measures programme/channel popularity. |
| Recall study | Measures whether audience remembers an ad/message/programme. |
| Callout research | Commonly used in music/radio testing and audience response. |
| Forced exposure | Used to test media/advertising material after controlled exposure. |
22. Public Opinion, Pre-election Studies and Exit Polls
| Research Form | Meaning |
|---|---|
| Public opinion survey | Measures attitudes of people on public issues. |
| Pre-election survey | Measures voter preference before election. |
| Exit poll | Collects voting information after people vote. |
| Tracking poll | Measures opinion repeatedly over time. |
| Margin of error | Expected range of sampling error in survey results. |
23. Readability Research
Readability research studies how easy or difficult a text is for readers. It may consider sentence length, word length, vocabulary, structure, layout and audience background.
| Readability Factor | Meaning |
|---|---|
| Sentence length | Shorter sentences are usually easier to read. |
| Word difficulty | Simple and familiar words improve readability. |
| Layout | Headings, spacing and paragraph length affect reading ease. |
| Audience level | Readability depends on education, language and familiarity. |
24. Data Analysis and Interpretation
| Analysis Type | Meaning |
|---|---|
| Descriptive analysis | Summarises data using frequency, percentage, mean and charts. |
| Inferential analysis | Uses sample data to make conclusions about a population. |
| Correlation | Measures relationship between variables. |
| Regression | Predicts one variable from another variable or variables. |
| Thematic analysis | Identifies themes in qualitative data. |
| Coding | Classifying qualitative or content data into categories. |
25. Research Report Writing
| Report Section | Content |
|---|---|
| Title | Clear statement of research topic. |
| Abstract | Brief summary of purpose, method, findings and conclusion. |
| Introduction | Background, problem, objectives and research questions. |
| Review of literature | Earlier studies and theoretical context. |
| Methodology | Research design, sampling, tools and procedures. |
| Analysis and findings | Presentation and interpretation of data. |
| Conclusion | Major findings, implications and limitations. |
| References | Sources cited in the study. |
26. Ethics in Communication Research
| Ethical Principle | Meaning |
|---|---|
| Informed consent | Participants should know the purpose and agree voluntarily. |
| Confidentiality | Participant identity and data should be protected. |
| No harm | Research should avoid physical, psychological or social harm. |
| Honesty | Do not fabricate, falsify or manipulate data. |
| Transparency | Report methods and limitations clearly. |
| Plagiarism avoidance | Credit sources and previous work properly. |
27. PYQ Mapping Table
| PYQ Source | Question Area | What to Revise |
|---|---|---|
| September 2013 Paper II | Causation | Co-variation as one condition in causation. |
| September 2013 Paper II | Variables | Intervening variable and control-variable area. |
| September 2013 Paper II | Audience research | Doordarshan Audience Research Unit study: lack of local specificity affected development programme viewership. |
| September 2013 Paper II | Central tendency | A single value representing a typical score in a distribution. |
| June 2010 Paper II | Standard error | Standard deviation of sampling distribution of means. |
| September 2016 Paper III | Sampling frame | Source of a sample. |
| September 2016 Paper III | Data point | Data point as observation. |
| September 2016 Paper III | Standard error | Standard deviation of the sampling distribution of means. |
| September 2016 Paper III | Content analysis | Categories should display exhaustivity. |
| September 2016 Paper III | Confidence interval | Range with known confidence asserting true values. |
| November 2017 Paper III | External validity | External validity and random samples. |
| November 2017 Paper III | Scaling | Thurstone scale and equal appearing intervals. |
| November 2017 Paper III | Experimental research | Demand characteristics in experimental situations. |
| November 2017 Paper III | Semantic differential | Bipolar objectives / bipolar adjectives. |
| January 2017 Paper III | Panel study | Same sample measured at different points of time. |
| January 2017 Paper III | Cohort analysis | Largely used in advertising research. |
| December 2006 Paper II | Variance and ANOVA | Square of standard deviation; R. A. Fisher and ANOVA. |
| December 2014 Paper III | Standard deviation and research bias | Spread of variables in a sample; double blind design/theory for communication bias. |
| September 2016 Paper III | Audience/ad research methods | Callout, CPM, Recall Study and Forced Exposure matching area. |
28. Frequently Repeated PYQ Areas
29. Quick Revision Sheet
| Term | One-line Revision |
|---|---|
| Communication research | Systematic study of communication processes, media, audiences and effects. |
| Hypothesis | Testable statement about relationship between variables. |
| Independent variable | Cause/predictor variable. |
| Dependent variable | Effect/outcome variable. |
| Sampling frame | Source list from which sample is drawn. |
| Panel study | Same sample studied at different points of time. |
| Content analysis | Systematic study of media content. |
| Exhaustivity | Content categories cover all possible cases. |
| Standard error | Standard deviation of sampling distribution of means. |
| Confidence interval | Range estimated to include true population value with known confidence. |
| Semantic differential | Scale using bipolar adjectives. |
| External validity | Generalisation of findings beyond the study sample/context. |
30. Practice Questions with PYQ Angle
Answer: Sampling frame.
PYQ Angle: September 2016 Paper III.
Answer: Central tendency.
PYQ Angle: September 2013 Paper II.
Answer: Standard error.
PYQ Angle: June 2010 Paper II and September 2016 Paper III.
Answer: Exhaustivity.
PYQ Angle: September 2016 Paper III.
Answer: Thurstone scale.
PYQ Angle: November 2017 Paper III.
Answer: Semantic differential.
PYQ Angle: November 2017 Paper III.
Answer: Points of time.
PYQ Angle: January 2017 Paper III.
Answer: Advertising research.
PYQ Angle: January 2017 Paper III.
31. Final Exam Tip
For Unit 10, revise through six tables: variables and hypothesis, sampling methods, research methods, measurement scales, basic statistics and PYQ mapping. This unit often asks direct definitions, method identification, statistical terms, sampling concepts and media-audience research examples.